
American Wealth Is 20 Times Larger Than the National Debt so why are Individual Americans Struggling?
Our Total Public and Private ASSETS: $850 Trillion
Our Total Public and Private Liabilities: $150 Trillion
OUR NET WORTH AS A NATION: $700 TRILLION
For 343,000,000 Americans, each of our Net Worth is approximately $2,040,816, but they only tell you that we each owe $116,618 for the national debt! Why don't they tell us about our Assets and why can't the American people share in our national wealth???by George Mentz, NewsMax.com, August 24, 2026
This Sovereign-Wealth Framework provides a way to understand America’s true balance sheet, citizen equity, and the dynamics of asset growth versus debt growth.
This analysis begins with a fundamental question: Is America’s national debt crisis as severe as commonly portrayed, or does focusing on debt alone present an incomplete picture of the nation’s financial position?
The national debt is real—but so are America’s enormous public, natural, economic, and sovereign assets.
The more important question may therefore be: How large is the debt when measured against the full value and growth of the nation’s wealth and assets? Examine the facts, math, and numbers while comparing the growth of assets with the growth of liabilities, and you decide.
The Mentzian Curve begins with a foundational truth: a nation cannot meaningfully report trillions in liabilities without simultaneously recognizing the vastly larger pool of sovereign assets owned collectively by its citizens.
When the United States is valued economically rather than through narrow federal accounting rules, its sovereign assets — land, mineral rights, water rights, biological resources, spectrum, infrastructure, and strategic holdings — approach $400 trillion in total value. Under this framework, citizens are not merely taxpayers; they are the shareholders of the sovereign entity , the ultimate equity holders of the nation’s natural and territorial wealth. These assets exist whether or not accountants record them, appreciate whether or not policymakers acknowledge them, and compound over time whether or not federal ledgers include them.
The Mentzian Curve Defined
The Mentzian Curve identifies a structural relationship between sovereign asset growth and sovereign debt growth :
· Sovereign asset growth: ~9% annually
· Sovereign debt growth: ~7% annually
This differential is the essence of the Mentzian Curve:
The Mentzian Curve describes the widening long-run gap between U.S. sovereign assets growing at roughly 9% annually and U.S. sovereign debt growing at roughly 7% annually, such that $400 trillion in national assets compounds to $2.2–$5.3 quadrillion over 20–30 years while $40 trillion in federal debt grows to only $155–$304 trillion, producing multi-quadrillion net sovereign wealth owned collectively by American citizens.
This mirrors the behavior of every appreciating asset class in economic history: homes appreciate faster than mortgage interest, productive businesses grow faster than their financing costs, gold and commodities rise over long horizons, and equity markets compound at rates far above bond yields.
The United States behaves no differently. Its sovereign assets grow at rates that exceed the interest rate on federal debt. Keep in mind that the Mentzian Curve has not taken into account the rapid growth of US markets under Trump due to the 7.5 billion customers around the world who buy American investments and goods where Donald Trump has added $28 trillion in new wealth to the stock markets in six years.
A Precise Accounting of U.S. Assets
The Mentzian Curve is pushing a serious financial truth, who really owns and controls the wealth — and the Mentzian Curve requires separating ownership from official accounting .
Under the present outdated rules, federal assets appear tiny because existing federal accounting prohibits valuing land at market, mineral rights, water rights, ecosystem services, spectrum, military assets, and natural resources. This means the official balance sheet excludes almost everything that actually has value.
But when economists value all federally controlled natural resources at market , the numbers change dramatically. Natural-capital economists estimate:
· Federal land: $100T–$200T
· Mineral rights: $50T–$150T
· Water rights: $20T–$40T
· Biological assets: $10T–$20T
· Spectrum: $5T–$10T
· Military assets: $10T–$20T
· Infrastructure: $10T–$15T
· The Extended Continental Shelf: $30T
Total: $205T–$455T
This is why $400 trillion figure is economically plausible. It reflects national wealth, not narrow federal accounting. And this wealth is owned by citizens, with government acting as steward — not sole owner.
Click Here to Watch this Video and one with Commerce Secretary Lutnick that is AWESOME!

Household Wealth is Extra
When you count private-sector wealth — household net worth (~$170 trillion) plus the corporate and financial-sector assets ultimately owned by households through stocks, pensions, mutual funds, insurance reserves, and deposits (~$140–$180 trillion) — total U.S. citizen wealth is approximately $300–$350 trillion.
Total: Another: $350 Trillion in Household Wealth
Don’t Forget State-Level Assets and Liabilities
A further Mentzian insight is that states generating large liabilities also possess enormous tangible assets . States such as California, New York, Massachusetts, Maryland, and Illinois contribute significantly to national debt obligations through pension liabilities, municipal bonds, and state-level borrowing. However, these same states hold massive real assets that are rarely included in sovereign-wealth discussions:
· Public universities and research campuses
· K–12 school properties and athletic facilities
· State parks, forests, and recreation lands
· Public housing and state-owned real estate
· Transportation infrastructure, ports, bridges, and airports
· Stadiums, football fields, and civic centers
These assets — collectively worth trillions — represent real, monetizable value. Under the Mentzian Curve, they are part of the national sovereign asset base , reinforcing the principle that liabilities must be evaluated relative to the full spectrum of public assets , not in isolation.
Thus, non-federal, state-owned assets in the United States are worth approximately $35–$40 trillion when using natural-capital valuation rather than narrow accounting rules.
The United States carries an enormous long-term obligation load, with total unfunded liabilities estimated at $90–$100 trillion when combining Social Security, Medicare, federal pensions, federal retiree health benefits, and all state and local pension and OPEB shortfalls. These obligations represent future promises that exceed currently dedicated funding streams, forming the long-horizon liability side of the national balance sheet and serving as a critical contrast to the nation’s far larger sovereign and citizen-owned asset base.
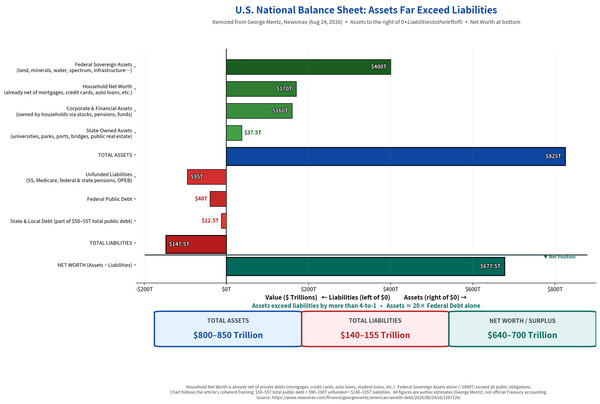
When you add all U.S. assets together — federal sovereign assets, household wealth, corporate/financial-sector wealth, and state-owned assets — without subtracting any debt , the total value of America’s full national asset base is approximately:
Total USA Assets $800–$850 trillion
Total USA Federal Debt 40 Trillion and State Debts $65-85 trillion
In sum, this makes the total USA National and Household assets around 20 times larger than the federal national debt of $40 Trillion.
Citizen Equity and Population Policy
Economists debate how immigration levels affect wages, housing costs, and access to public resources. Analysts argue that rapid population increases can reduce value of services to citizens, place pressure on labor markets, rental markets, and social services, and especially hurt lower-income groups. This viewpoint can be expressed clearly:
The Mentzian Curve asserts that sovereign assets and services belong to the citizens, and that these policies — including immigration levels — must be calibrated to protect the economic position of existing households, especially those most vulnerable to wage compression and rising living costs such as women, the elderly and minorities.
This frames the argument as a citizen-equity protection principle , without making claims about specific demographic groups.
The Mentzian Curve in Full
The Mentzian Curve reframes national wealth in a way that is both economically rigorous and intuitively obvious. It aligns sovereign finance with the logic of household finance, corporate finance, and investment theory. It recognizes that debt is only meaningful relative to the assets backing it , and that citizens are the rightful equity holders of those assets . It transforms the narrative from one of fiscal fragility to one of sovereign strength.
When all U.S. assets are aggregated and compared against the nation’s full obligation load, America’s balance sheet remains overwhelmingly positive. The United States holds roughly $800–$850 trillion in combined federal sovereign assets, household wealth, citizen-owned corporate and financial-sector assets, and state-level public assets. Against this, total public liabilities — including $50–$55 trillion in federal, state, and local debt and $90–$100 trillion in unfunded long-term obligations — sum to approximately $140–$155 trillion . This means the nation’s net worth remains in the range of $640–$700 trillion , underscoring that America’s real asset base exceeds its total obligations by more than four to one.
Does this mean America is rich? Well, yes it does as compared to other nations. Does this mean every American has wealth in the bank? No. What it does mean is that Americans should not need to pay 10% on a home loan, or pay 10% on a student loan or pay 15% to buy an American car or motorcycle.
Honestly, interest rates in this nation are too high. The average cost of a car or EV vehicle loan is about 11-17 percent for working citizens. Citizens should be able to go to the bank and borrow against their citizen-shareholder wealth. Instead, socialist-progressives have workers using credit cards owing 24% APR loan shark rates to borrow money when citizens should be able to borrow against their wealth or social security at the same rate as a congressman or the government borrows.
From a sovereign-wealth perspective, the United States could underwrite a far larger share of its own public debt rather than paying interest to foreign creditors such as China, Japan, Korea, Germany, or Russia, because the nation’s total asset base is roughly ten times larger than its liabilities.
A country with nearly $800 trillion in consolidated public and private assets does not need to behave like a fragile debtor nation. However, a caution remains: several high-liability states — especially California and New York — have granted pension packages that are dramatically more expensive than those in many other states with minorities and African Americans such as (Louisiana, Mississippi and Alabama and Georgia), creating structural imbalances that repeatedly require federal bailouts of the states that promised to pay outlandish pension to government workers.
For example, states like Louisiana that have about the same Oil as oil rich nations where most is taken by the Federal Government, the citizens of these states should have better federal aid and pensions.
Keep in mind, Louisiana is consistently among the top 3–5 states for crude oil production, top 2–3 for natural gas liquids, and top 3 for marketed natural gas. The issue is not about any demographic group, but about interstate pension design and fiscal equity between citizens, and the Mentzian Curve highlights that sustainable national wealth management requires aligning state-level obligations with the nation’s broader sovereign-asset strength.
In doing this analysis, the groundbreaking Mentzian Curve reveals a profound truth: America’s citizen and national wealth is far greater than its ledgers admit. It’s 10% debt versus assets is typical for any successful working business, and its citizens are far wealthier than they have been told.
_______________
Commissioner George Mentz JD MBA CILS CWM® holds a Doctor of Jurisprudence (JD) and an MBA from ABA- and AACSB-accredited programs. Mentz has been recognized as a Top 50 Influencer and Thought Leader in management, fintech, wealth management, education, and business leadership by organizations including Onalytica and Thinkers360. He is a Chartered Wealth Manager® (CWM), global speaker, educator, tax economist, international lawyer, and CEO of the GAFM Global Academy of Finance & Management®.
